The YOY Sales report allows you to compare your sales performance across multiple years within the same reporting period. This can help you quickly assess patterns, growth, or decline in business performance.
Step-by-Step Instructions
-
Navigate to
Performance > Reports. -
Select YOY Sales from the list of available reports.
-
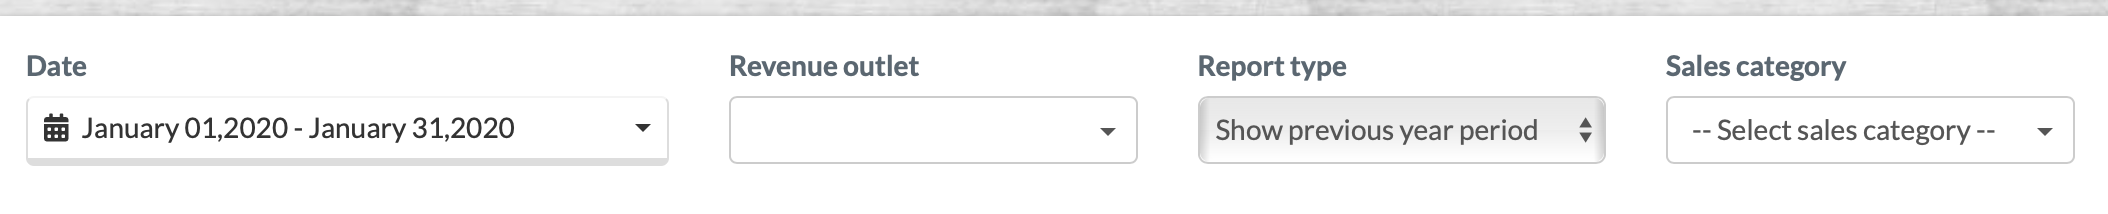
Choose your reporting parameters:
-
Outlet – the site you wish to report on.
-
Date Range – the time period you want to compare year-over-year.
-
-
Run the report to view a breakdown of sales by:
-
Sales category
-
Year
-
Revenue totals
-
The results will display in a comparative table and chart format, allowing easy analysis of performance trends across years.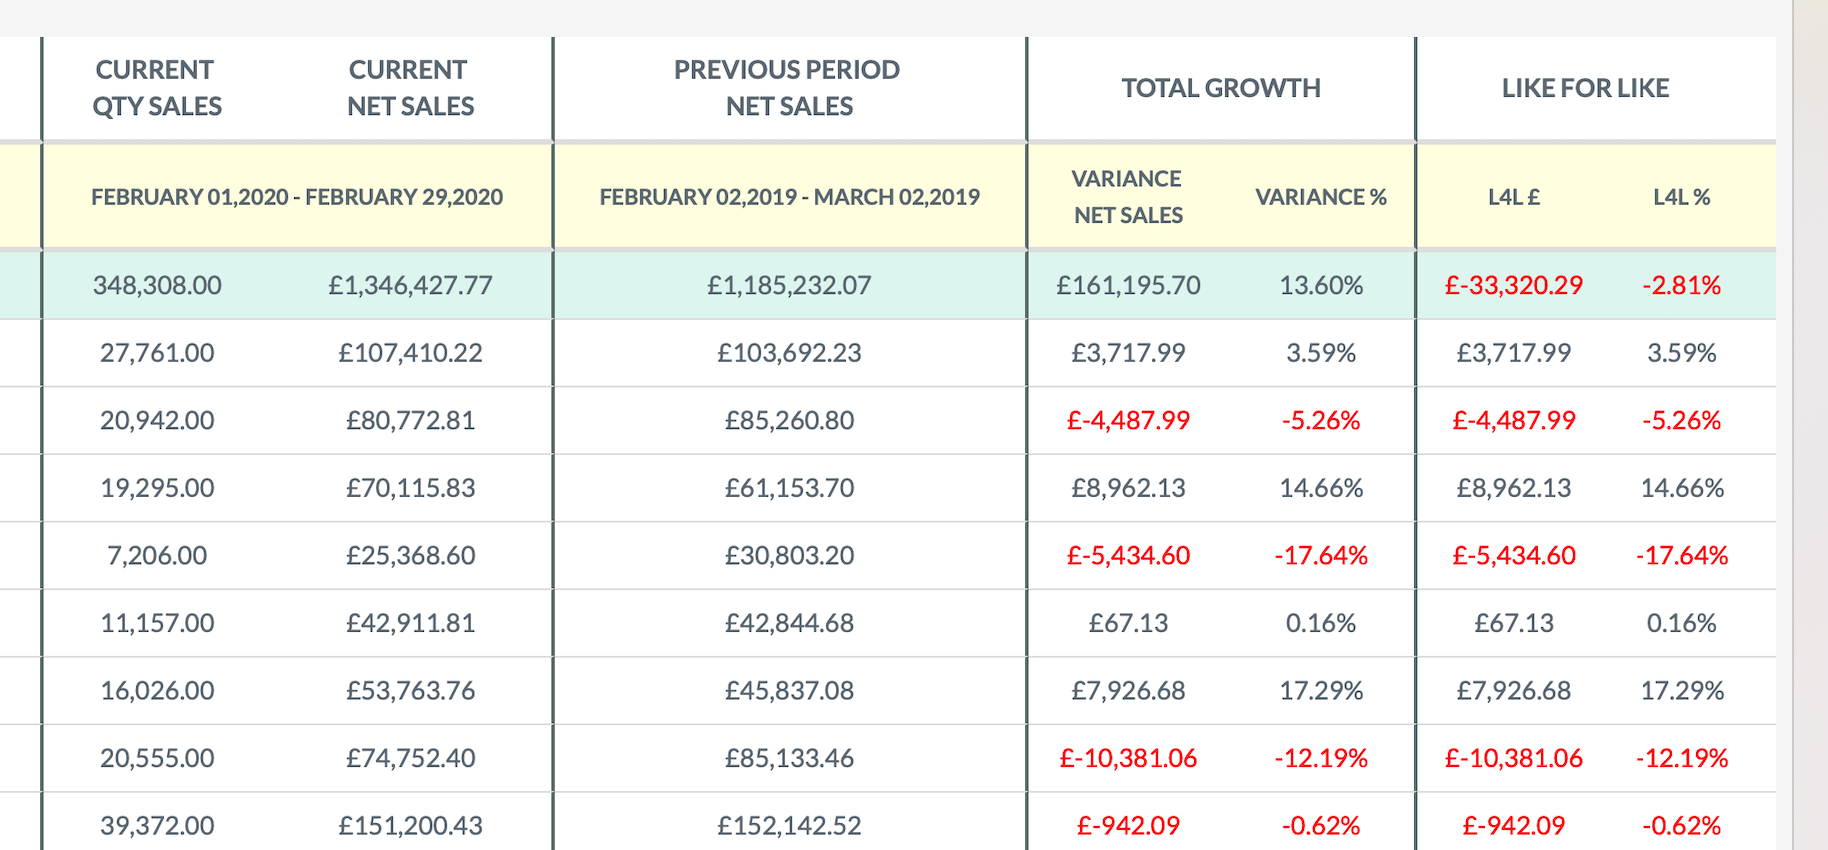
💡 Best Practices
-
Use consistent date ranges (e.g. full weeks or months) toget a meaningful like-for-like comparison.
-
Use this report at the end of each period or quarter to track growth or seasonal dips.
-
Combine with the Net Summary report for deeper insight into category performance.
❓ FAQs
Can I export the YOY Sales report?
Yes, use the export icon at the top of the report to download the data as a CSV or Excel file.
Can I compare multiple outlets?
Not in a single report – you’ll need to run separate reports per outlet.
🆘 Need Help?
📧 Email us at support@kitchencut.com
📝 Submit a support ticket