The Theoretical Sales Report provides a performance overview of your menu items by analysing actual sales data. This report helps determine the profitability and popularity of each item using Kasavana and Smith’s Menu Engineering matrix — classifying each item as a:
-
⭐ Star – High profitability & high popularity
-
🐎 Plowhorse – Low profitability & high popularity
-
🧩 Puzzle – High profitability & low popularity
-
🐶 Dog – Low profitability & low popularity
📈 What Does the Report Do?
Unlike the Cost Modelling report (which requires manual sales quantity input), the Theoretical Sales report uses actual EPOS sales data to automatically classify Menu Items. This allows you to:
-
Make evidence-based menu decisions
-
Identify underperforming items
-
Optimise for profit and popularity
-
Understand item contribution to revenue
How to Access the Report
1. Navigate to:
Revenue > Reports > Theoretical Sales
2. Apply Your Filters: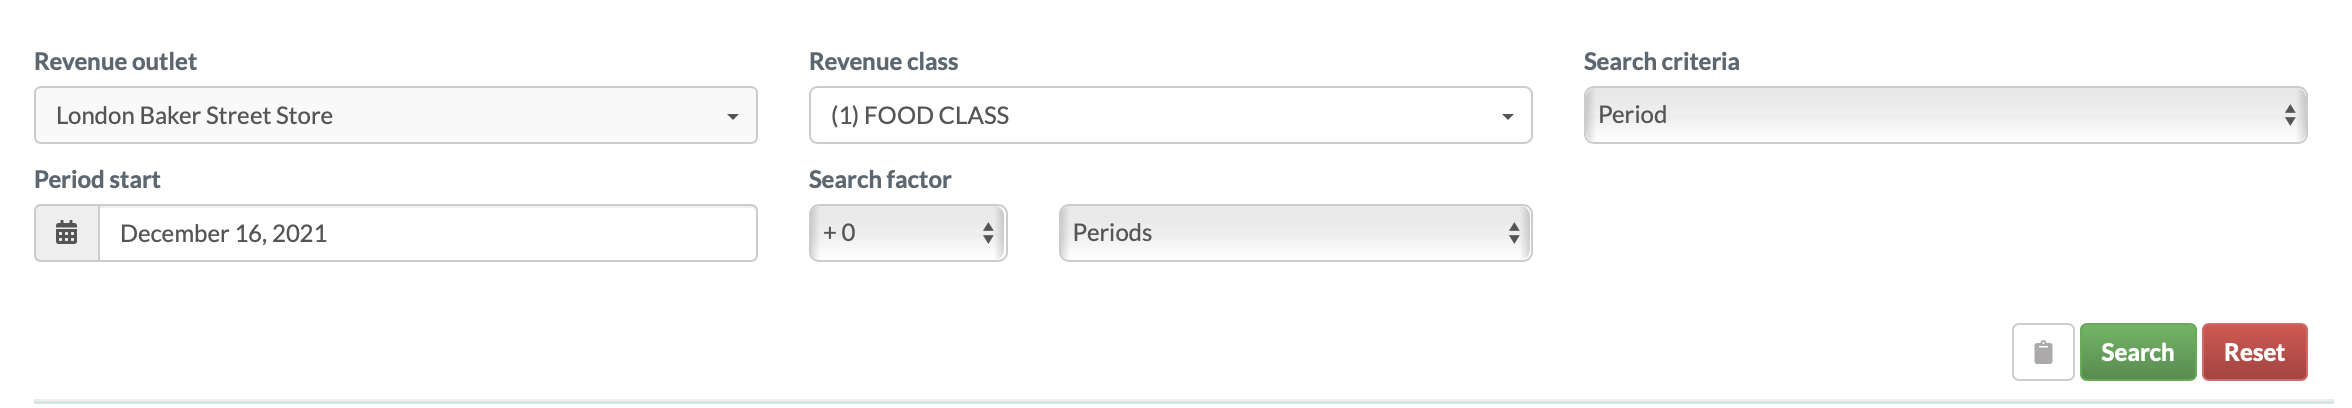
-
Outlet
-
Revenue Class (e.g. Food, Beverage, Consumables)
-
Date Range or Sales Period
Then click Search to generate your results.
📊 Interpreting the Report Output
The report displays a drill-down table, organised by Sales Category. Click each row to expand and reveal individual Menu Item results.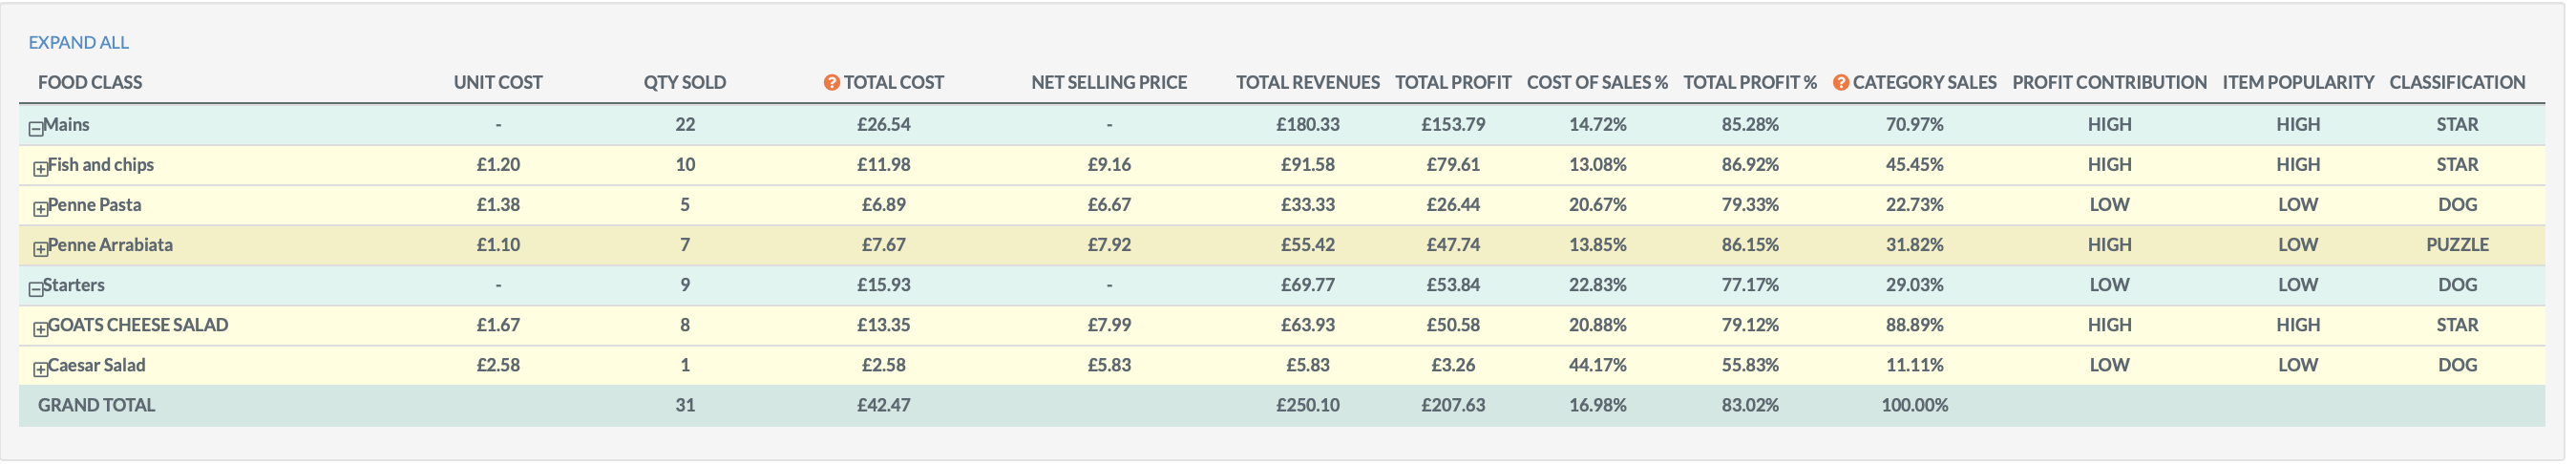
🧮 Column Breakdown:
-
Unit Cost: Cost to produce one portion, inclusive of recipe wastage
-
Qty Sold: Number of portions sold during the selected period
-
Total Cost: Total cost of all portions sold (may not exactly equal Unit Cost × Qty Sold due to calculation precision)
-
Net Selling Price: Selling price excluding VAT
-
Total Revenues: Net Selling Price × Qty Sold
-
Total Profit: Total Revenues – Total Cost
-
Cost of Sales %: (Total Cost ÷ Total Revenues) × 100
-
Total Profit %: (Total Profit ÷ Total Revenues) × 100
-
Category Sales: The item’s percentage contribution to total sales in its category
-
Profit Contribution: Whether the item’s total profit is above or below the category average
-
Item Popularity: Whether the quantity sold is above or below the category average
⚠️ Important Notes
-
Live Menu Changes:
Sales data is calculated based on the Menu Item’s cost, tax, and pricing at the time of processing. If prices or costs have changed mid-period, the numbers may not match exactly across rows (e.g. Total Revenue ≠ Qty Sold × Selling Price). -
Relative Classifications:
The Star / Dog / Puzzle / Plowhorse classifications are calculated relative to other items in the same sales category — and only for the date range selected.📌 A Menu Item may fall into different classifications depending on the period or filters selected.
💡 Best Practices
-
Run this report monthly or per period to monitor shifts in item performance
-
Focus on boosting margins of Plowhorses and visibility of Puzzles
-
Consider removing Dogs — unless they play a strategic role (e.g. dietary options)
-
Use alongside the [Cost Modelling Report] to plan upcoming menu changes
-
Pair with [POS > Menu Items] to ensure all items are correctly mapped and costed
❓FAQs
What if my sales figures don’t match the selling price × quantity sold?
This usually happens due to mid-period changes to pricing or tax. Each day’s sales are processed using the configuration at the time of upload.
Can an item change classification over time?
Yes. Classifications are always relative to other items in the same sales category and filtered report, so they can vary depending on performance trends and filter choices.
What’s the difference between this and Cost Modelling?
Theoretical Sales uses actual sales data, while Cost Modelling allows you to simulate performance based on forecasted sales volumes.
🆘 Need Help?
📧 Email Support: support@kitchencut.com
📝 Submit a Ticket: Submit a ticket