The Operating Stock Report provides a detailed breakdown of stock activity across your outlet(s), allowing you to compare theoretical and actual stock levels, identify variances, and investigate potential operational issues. It is a key reporting tool for spotting gaps in stock tracking such as unmapped sales, missed deliveries, or unreported wastage.
How to Access the Report
Navigate to:
Inventory > Stock > Operating Stock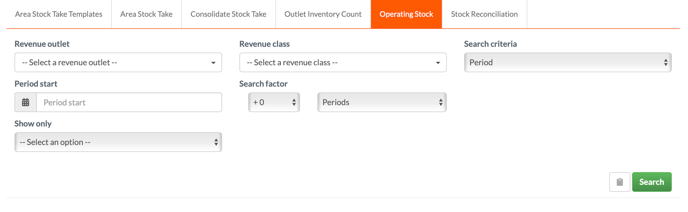
OR
View OPS of a specified period using the actions drop-down located next to the period.
⚙️ Report Setup Options
Before generating the report, you can customise the output using the following filters:
-
Revenue Outlet – Select the specific outlet(s) you wish to report on
-
Revenue Class – Choose the relevant purchasing class (e.g. Food, Beverage, Consumables)
-
Search Criteria – Choose whether to view data by:
-
Stock Period (defined in your inventory cycle)
-
Custom Date Range
-
-
Period Start / Date Range – Enter the stock period or start/end dates depending on the above selection
-
Search Factor – Optional refinement to narrow down results
-
Item Type Filter – Choose whether to display:
-
Products
-
Recipes
-
Sub-recipes
-
Report Structure
The report is presented as a column-based breakdown, grouped in the following order:
-
Outlet
-
Category
-
Individual line items (products, recipes, or sub-recipes)
Each row displays the following data:
-
Opening Stock Value - The stock valuation at the time of the opening count.
-
Deliveries - Any confirmed deliveries that fall within the defined period.
-
Transfers - Any completed transfers between revenue outlets.
-
Wastage - Wastage recorded on Kitchen CUT.
-
Usage - Depletion from EPOS sales
-
Theoretical Closing Stock - The expected stock valuation.
-
Actual Closing Stock - The stock valuation at the time of the closing count.
-
Variance - Between theoretical and actual

🛠️ Customising the Report View
-
Use the Adjust Table View dropdown to hide or show specific columns as needed.

-
This allows you to simplify the output or focus on specific areas (e.g. wastage, variance).
Live Theoretical Calculations
-
If you select an open stock period, the report will calculate theoretical figures live, up to the last uploaded sales record.
-
This is particularly useful for ongoing performance checks before a period is closed.
🧠 What the Report Helps You Identify
This report is a valuable operational tool for detecting:
-
Unmapped sales items (causing underreported usage)
-
Deliveries not yet accepted (appearing as missing stock)
-
Missing or incomplete wastage reporting
-
Unexpected variances in theoretical vs. actual closing stock
-
Incorrect inventory settings across classes or outlets
💡 Best Practices
-
Focus on high-variance categories or products — these often highlight underlying system or operational issues.
-
Encourage teams to regularly update deliveries and submit wastage correctly to improve report accuracy.
-
Use filters and view customisation to tailor reports to different outlet managers or stock controllers.
❓FAQs
Can I export the Operating Stock Report?
Yes — use the export button at the top of the report to download a copy in Excel format.
Why are some theoretical closings inaccurate?
Check for missing mappings, unconfirmed deliveries, or missing sales data uploads.
Does the report update automatically?
Yes — theoretical data updates in real time for open periods, based on the latest available sales and stock entries.
🆘 Need Help?
📧 Email Support: support@kitchencut.com
📝 Submit a Ticket: Submit a ticket