The Net Summaries Report (formerly called Sales Summary) provides a high-level overview of actual vs. theoretical sales. It consolidates day-by-day EPOS or online sales data into a clear, structured view — allowing you to evaluate revenue performance and highlight potential discrepancies.
How to Access the Report
Navigate to:
Revenue > Reports > Net Summaries
Apply Filters:
-
Date Range or Inventory Period (for Inventory users)
-
Revenue Class (e.g. Food, Beverage, Consumables)
-
Sales Category (optional)
Click Run Report to generate your results.
📊 What the Report Shows
At the top of the report, you’ll see: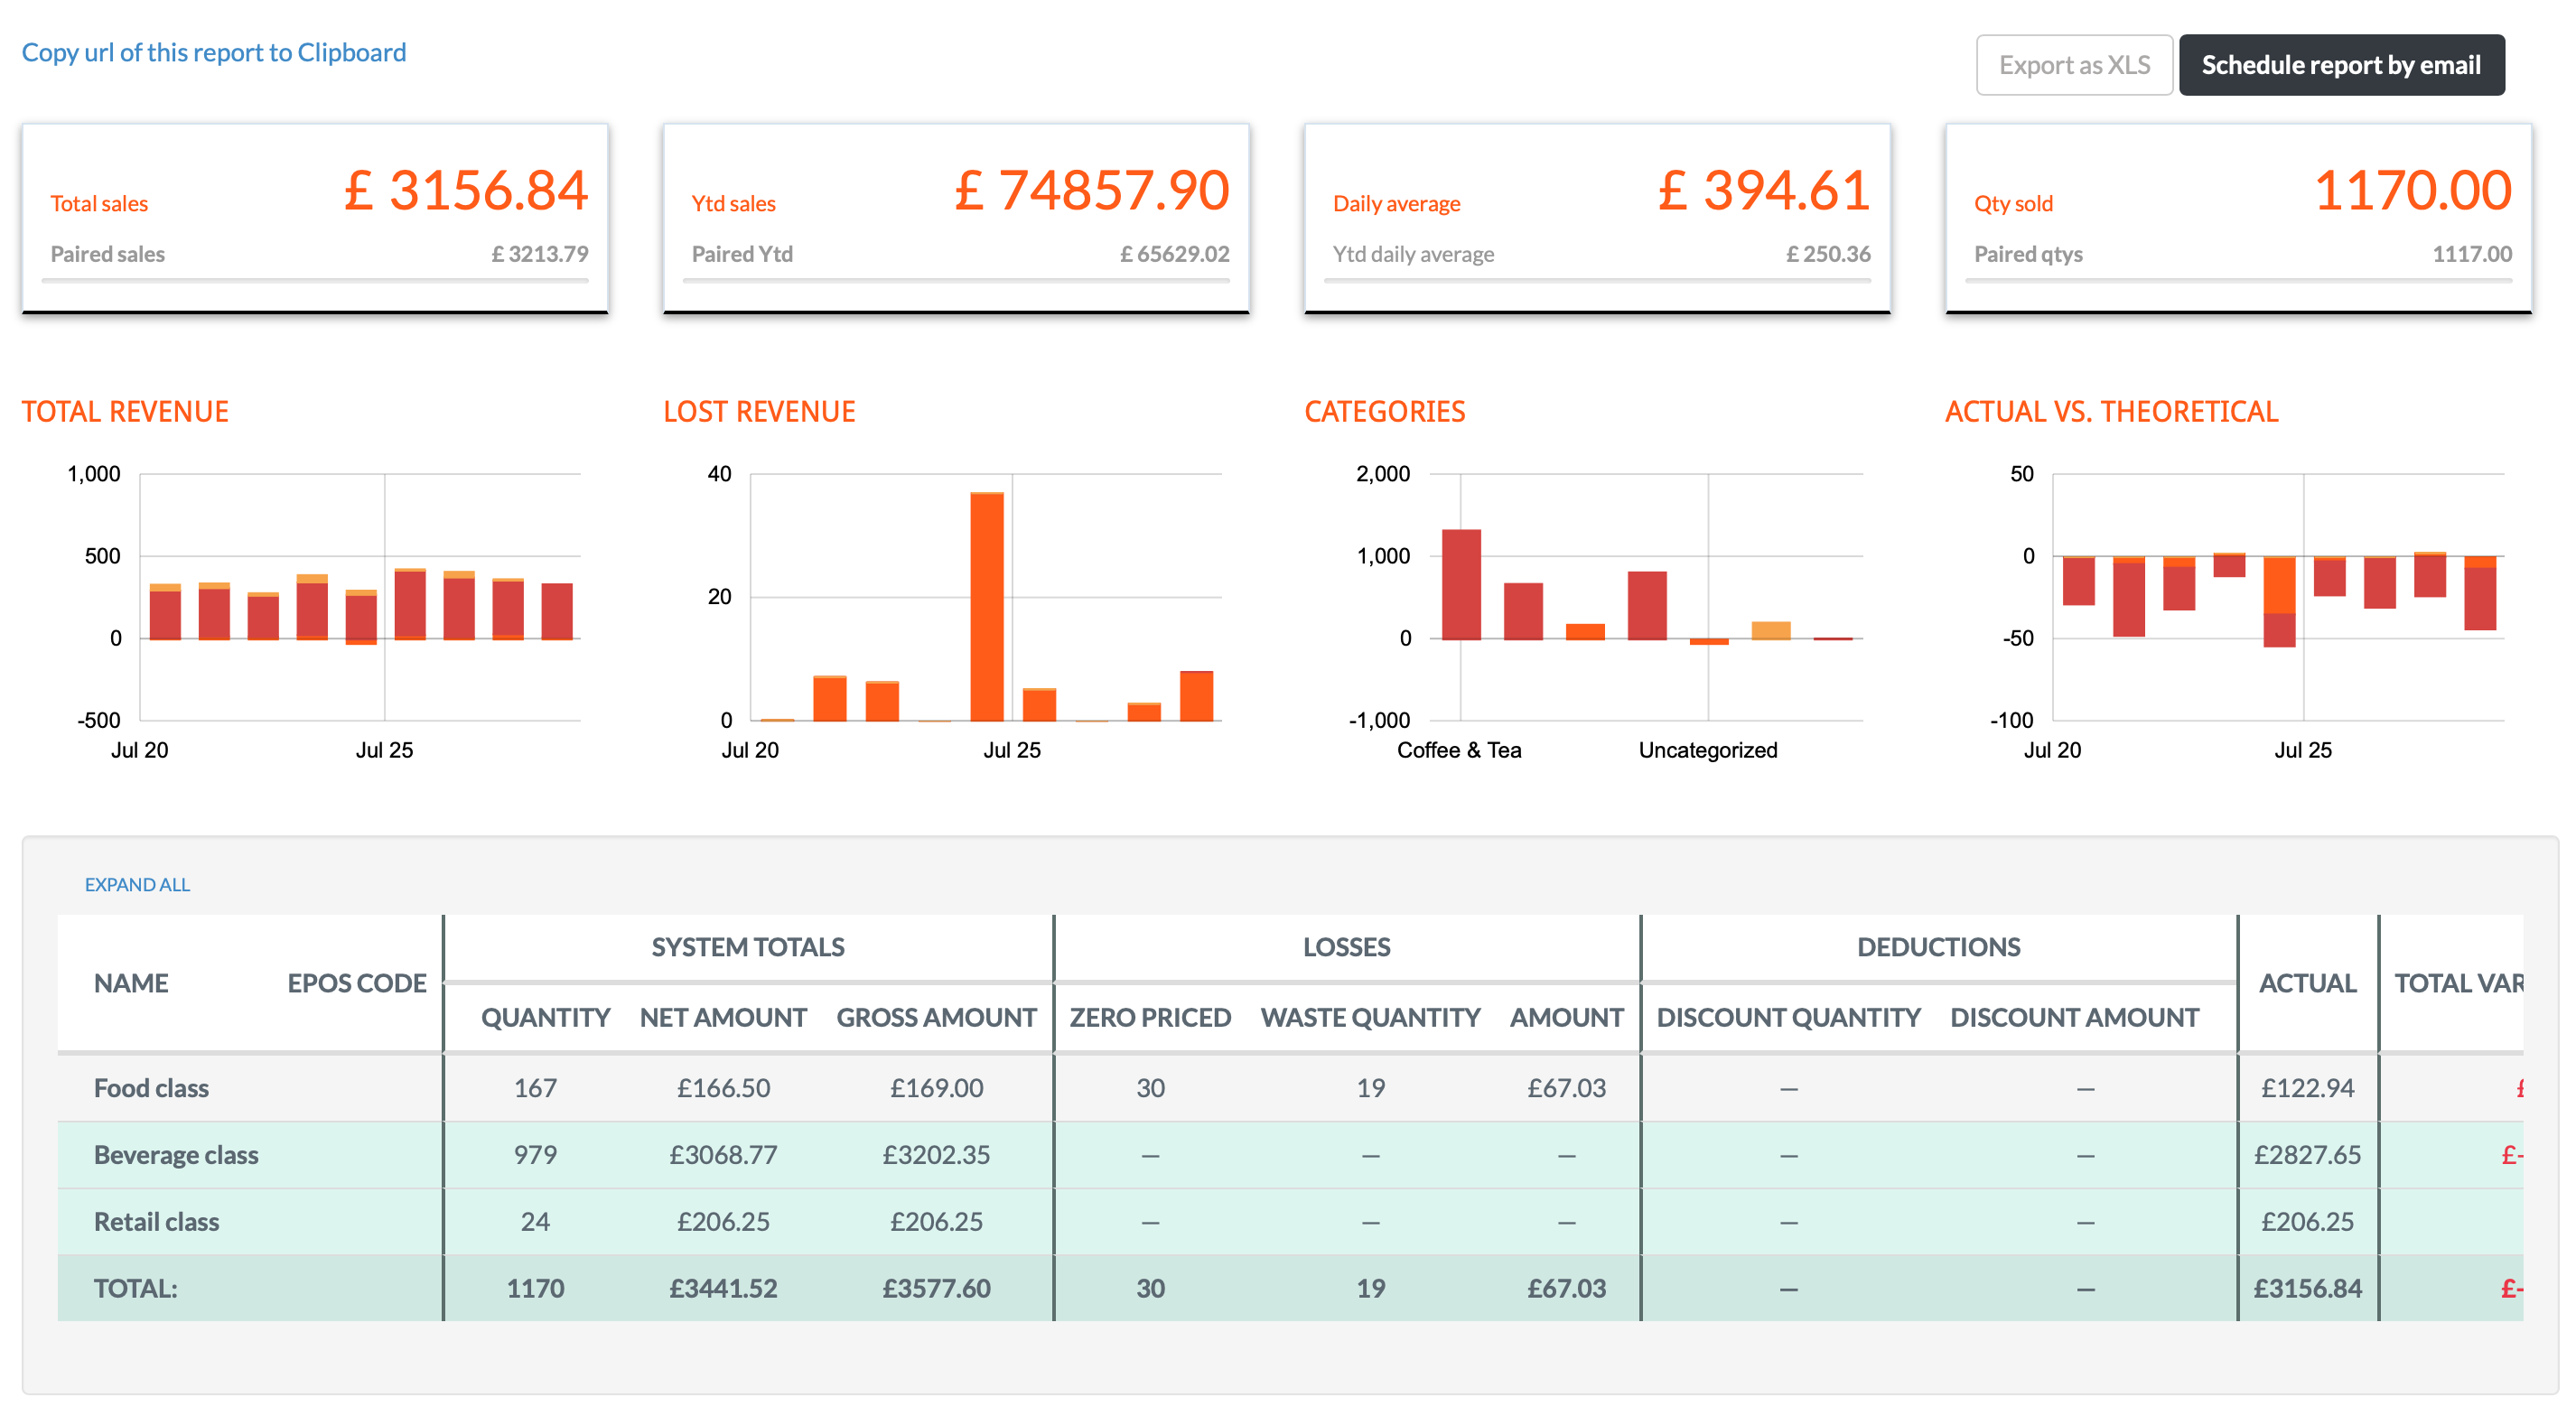
-
Headline figures (Net totals, Gross totals, etc.)
-
Summary charts for visual performance analysis
Scroll down to find the Net Summary Table — a drill-down view that allows you to explore sales data:
-
Begin at Revenue Class level
-
Expand rows to view Sales Categories
-
Drill into individual Menu Item sales by clicking the category rows
Key Columns Explained
-
Actual:
Net revenue pulled directly from your EPOS or Digital Menus (Online Sales) — this reflects real income after any discounts. -
Net Amount (System Total):
Theoretical Net Revenue based on the selling prices entered into your Menu Items in Kitchen CUT. -
Gross Amount (System Total):
Theoretical gross revenue (before tax), also based on configured prices. -
Variance:
The difference between the Net Amount (theoretical) and the Actual sales.This represents Lost Revenue, typically due to discounts, promos, or manual price adjustments at the point of sale.
⚠️ Important Notes
-
System Totals depend on your Menu Item setup:
If selling prices are incorrect or out of date in Kitchen CUT, the Net and Gross Amounts may not provide meaningful insight. -
Actual figures are pulled directly from EPOS or Online Sales
These reflect what was truly sold and at what price — including any customer-facing offers or markdowns. -
Use the Variance column to identify lost revenue opportunities
Regularly reviewing this can help surface issues like excessive discounting or incorrect till pricing.
💡 Best Practices
-
Keep Menu Item pricing up to date for accurate theoretical comparisons
-
Use this report to spot discounting trends and identify outlets with pricing inconsistencies
-
Combine with the [Theoretical Sales Report] to analyse profitability alongside revenue
-
Check variances regularly to catch training issues or pricing misconfigurations
❓FAQs
Why is there a variance between Net Amount and Actual?
This is typically due to discounts, offers, or manual till overrides. The Net Amount represents the ideal sales revenue based on the full listed price, while the Actual reflects what was truly received.
Can I run this report by inventory period?
Yes — if you're using the Inventory module, you can filter by stock periods instead of date ranges.
Do Online Sales appear in this report?
Yes — orders from Digital Menus and F&B To Go (if applicable) are included alongside EPOS sales data.
🆘 Need Help?
📧 Email Support: support@kitchencut.com
📝 Submit a Ticket: Submit a ticket