Cost Modelling/Menu Engineering
The Cost Modelling report is typically to be used in a prospective manner, using sales quantity projections to model your menu performance. It uses theoretical figures based on your recipes and the information you input (recipe cost, recipe sales price, recipe tax%, recipe wastage%) to project costs, revenues and margins across selected dishes.
To create a report, Select Menu Costing > Cost Modelling.
Then select ‘Add New’. You will be prompted to complete the below form. Select which Outlet and Revenue Class, and then add Reporting Category (eg. Starters/Mains/Desserts). Then search and add your recipes, and select how many portions you are predicting to sell or have sold. Add as many Reporting Categories (Courses) and recipes as you like.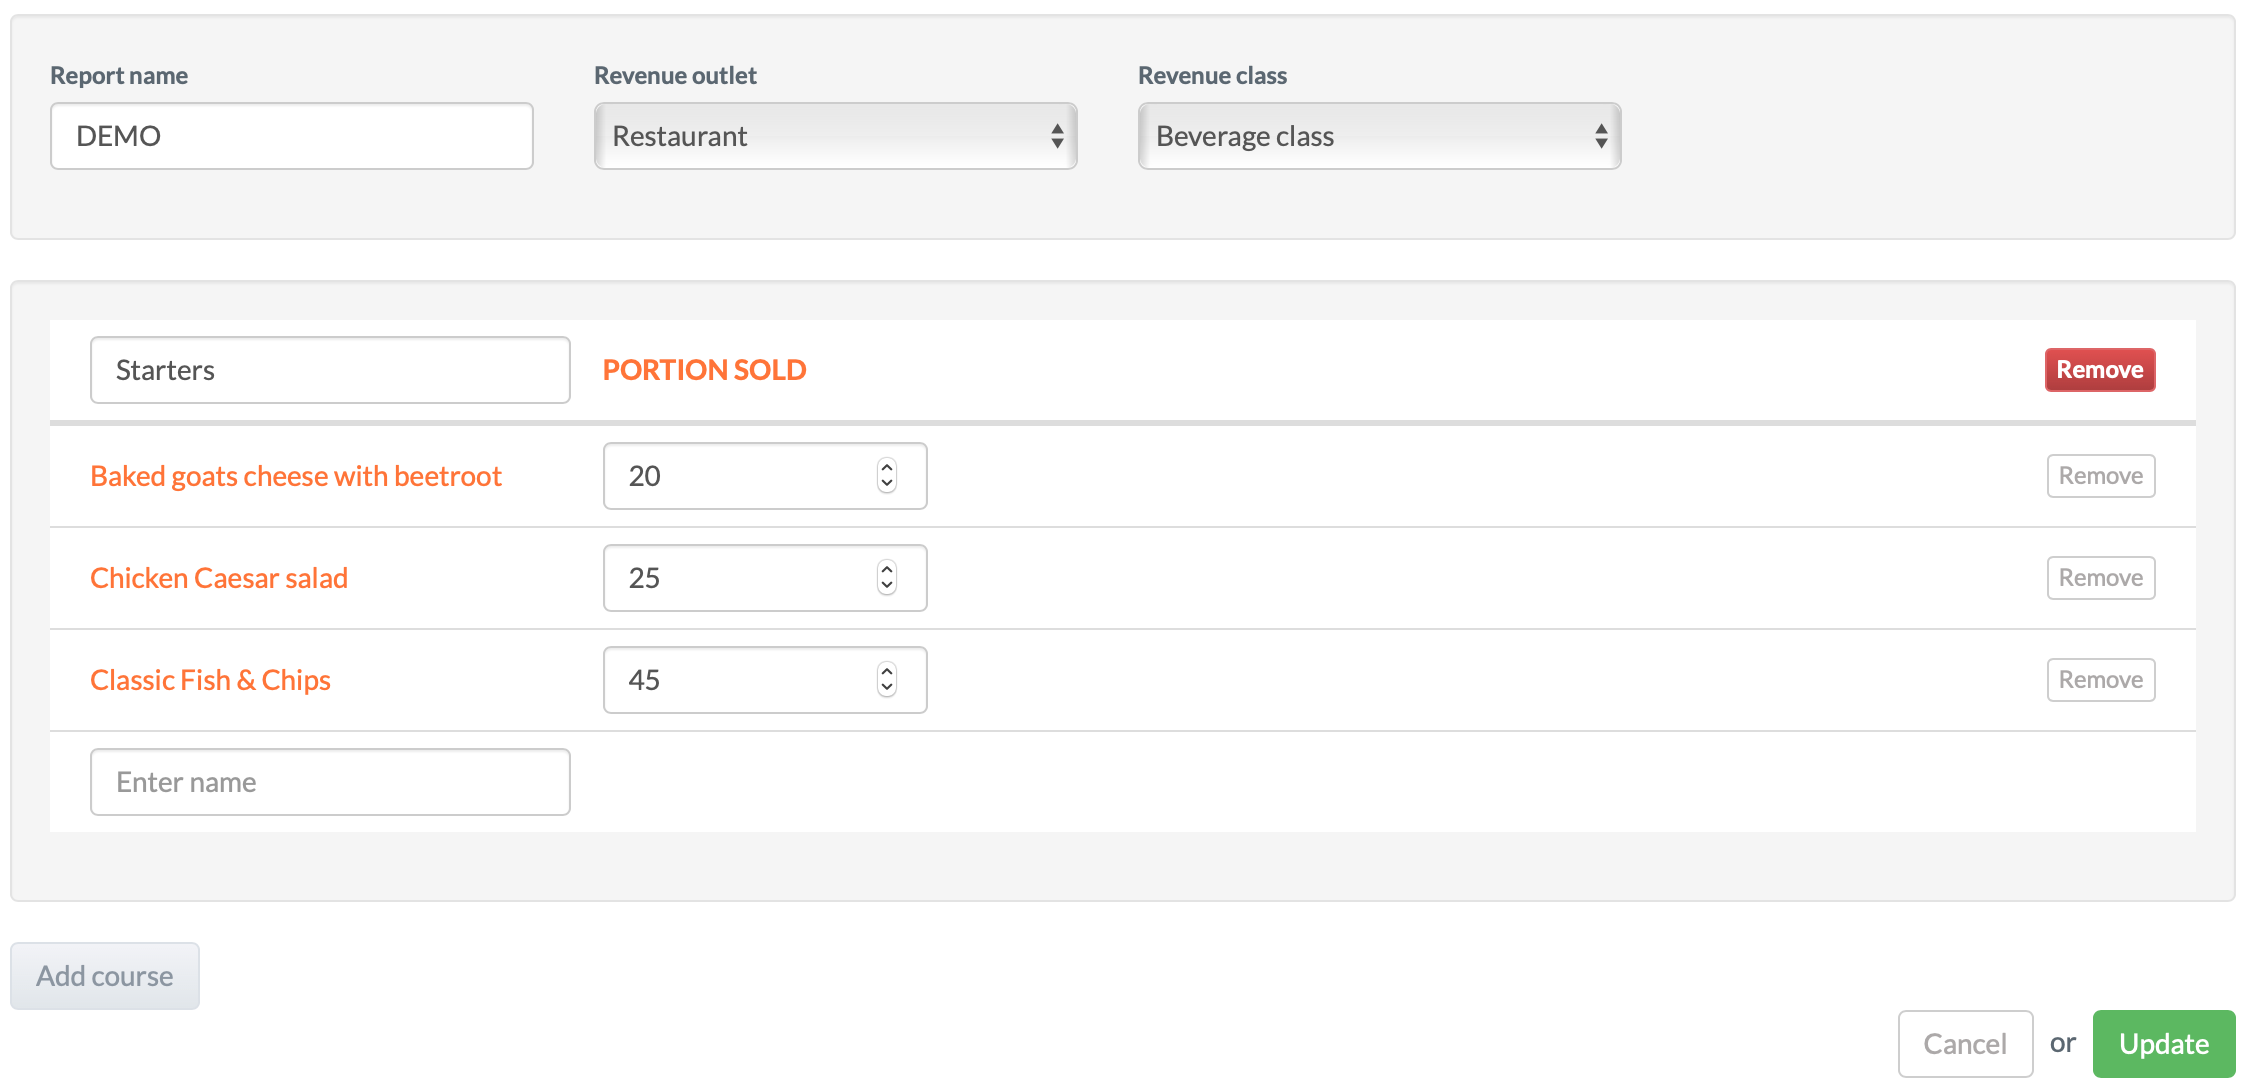 Then just click ‘Create’, and your report will be generated. You can review these reports by clicking on Actions> View.
There’s 4 parts to the Cost Modelling report, detailed as follows:
This is an overall THEORETICAL summary where you can scroll down through the information.
Here is an example of one: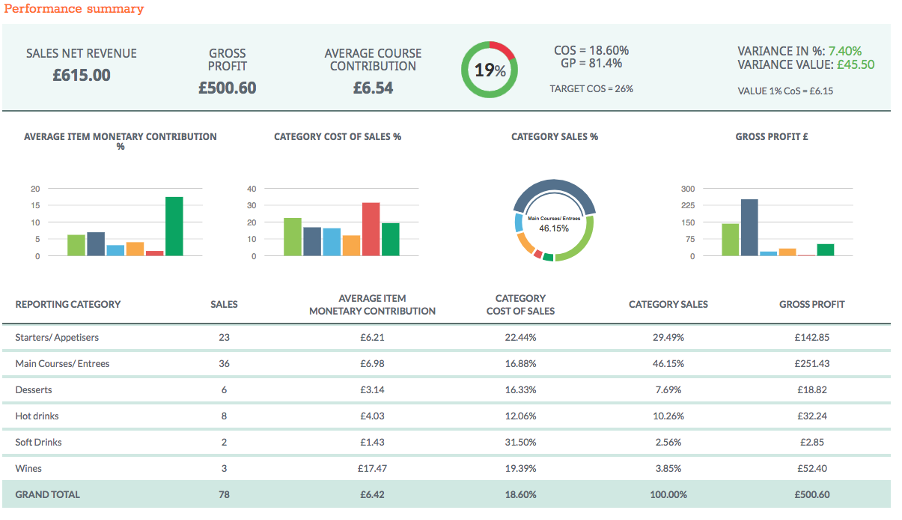
- Sales Net revenue - is the total sales recorded less any tax (if applicable).
- Gross Profit – is a Theoretical Gross profit.
- Average Course Contribution - is taking the Average Gross profit contribution of all items.
- COS - Cost of sales % What it cost to produce those items as a % of sales
- GP - Gross profit % - What Gross profit should be made as a % of sales.
- Target COS - is what you have set your target as.
- Variance in % - is the % variance between target and actual.
- Variance Value - is the monetary Variance between target and actual.
2. Classification
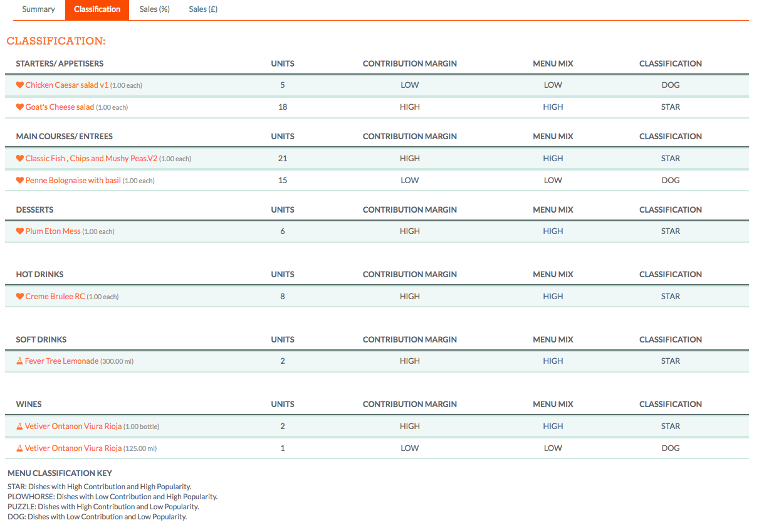
This again is also working on Theoretical figures.
Dishes are categorised according to Kasavana and Smith's Menu Engineering framework as Stars, Plowhorses, Puzzles or Dogs according to their popularity and contribution to revenue. The definitions of these categories are explained at the bottom-left-hand side of this report.
This part is to tell you in “Menu Engineering terminology” how each dish / item is performing.
3. Sales (%)
This is looking at % of sales so you can make a comparison against your dishes/ item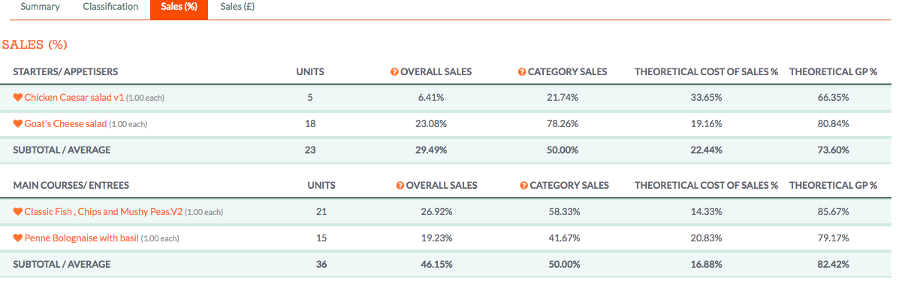
- Units- is how many has been sold of each item
- Overall Sales- is the % of overall sales for each item/ category
- Category Sales- % sales within this category with Category Average
- Theoretical cost of sales- working from the selling prices on recipes and products
4. Sales (£)
Arguably the most important part of Cost Modelling/Menu Engineering.
How much money SHOULD I be making?
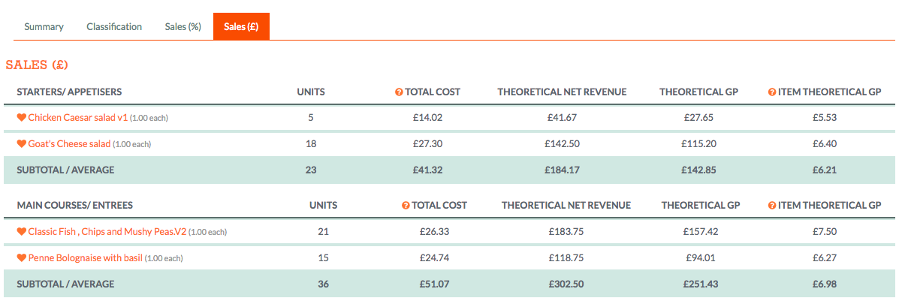
- Units- is how many has been sold of each item
- Total cost- total of the recipe/ item (Including wastage is applicable)
- Theoretical Net revenue- is what you should have taken from your actual selling prices for each recipe/ item.
- Theoretical GP- how much money should I be making for each item considering how many I have sold.
- Item Theoretical GP- Here you can see how much you should be making for each item.
NB – Cost Modelling / Menu Engineering is a hugely powerful document and by having visibility like this on your business, you can make sensible, calculated decisions on what you do with your menu.